Evaluation of stationary demand models
Objective
Select a suitable model among the given choices.
Introduction
TrainMax is a manufacturer of high‐end specialty engine equipment for high speed trains. They produce parts that are sent to the original equipment manufacturers (OEMs) for manufacturing new engines. They face a continuing challenge of trying to forecast demand for their products. The demand for one part in particular, XC‐288, was highlighted as needing to be examined.
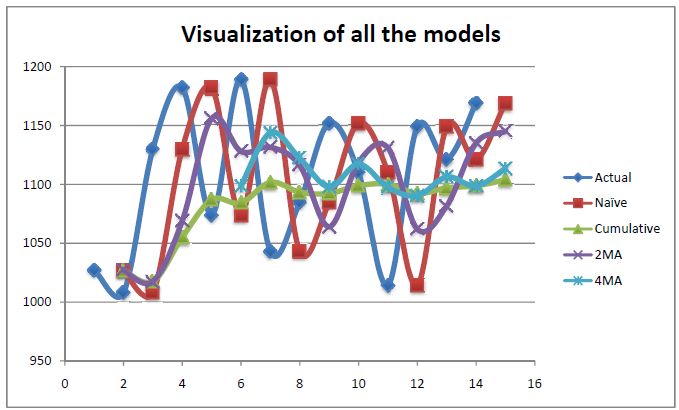
Visualization of all the models
Check for stationary demand
One way of doing is to determine the coefficient of variation (CV)
\[ CV=\frac{STDEV(data)}{AVERAGE(data)} \]
We get
| STDEV | 62.6899312 |
|---|---|
| AVERAGE | 1103.78571 |
| CV | 0.05679538 |
CV is very low & hence the demand is quite stationary & stable in nature.
Calculations among the models
| Prediction for period 15 | MAPE(%) | |
|---|---|---|
| Period 14 value | 1169 | |
| Naïve | 1169 | 7.08446274 |
| Cumulative | 1103.78571 | 5.13422811 |
| 2MA | 1145 | 6.46420824 |
| 4MA | 1113.25 | 4.79251584 |
Here we see that the moving average forecasts need not always be between the naïve & cumulative forecasts.
Selection of the model in the presence of a trend
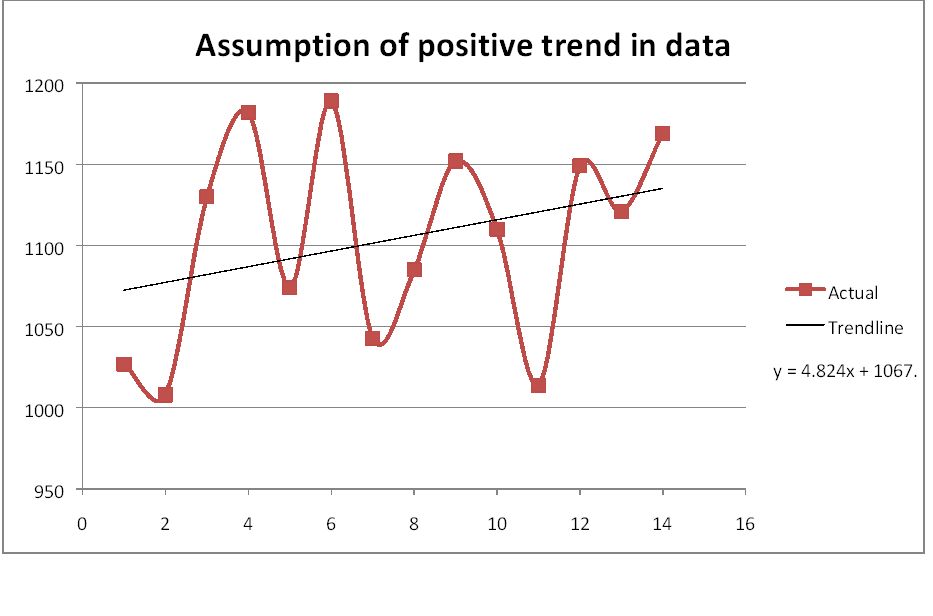
If we assume there is a positive trend in the data then none of these models are appropriate for demand with a trend pattern. The Cumulative, Naive, and Moving Average forecasts all assume stationary demand. That means that you only assume a Level pattern to the demand with some random noise.