Improving the naïve model forecast using cumulative period model
Objective:
Comparing error metrics by switching naïve model to cumulative model.
Introduction:
You have been hired by General Miles, a company that produces healthy gluten‐free breakfast cereal bars. The last market introduction happened a year ago and your manager thinks there might be an issue in the forecasting methodology. They are currently using a simple Naive forecasting model and you think there might be some room for improvement.
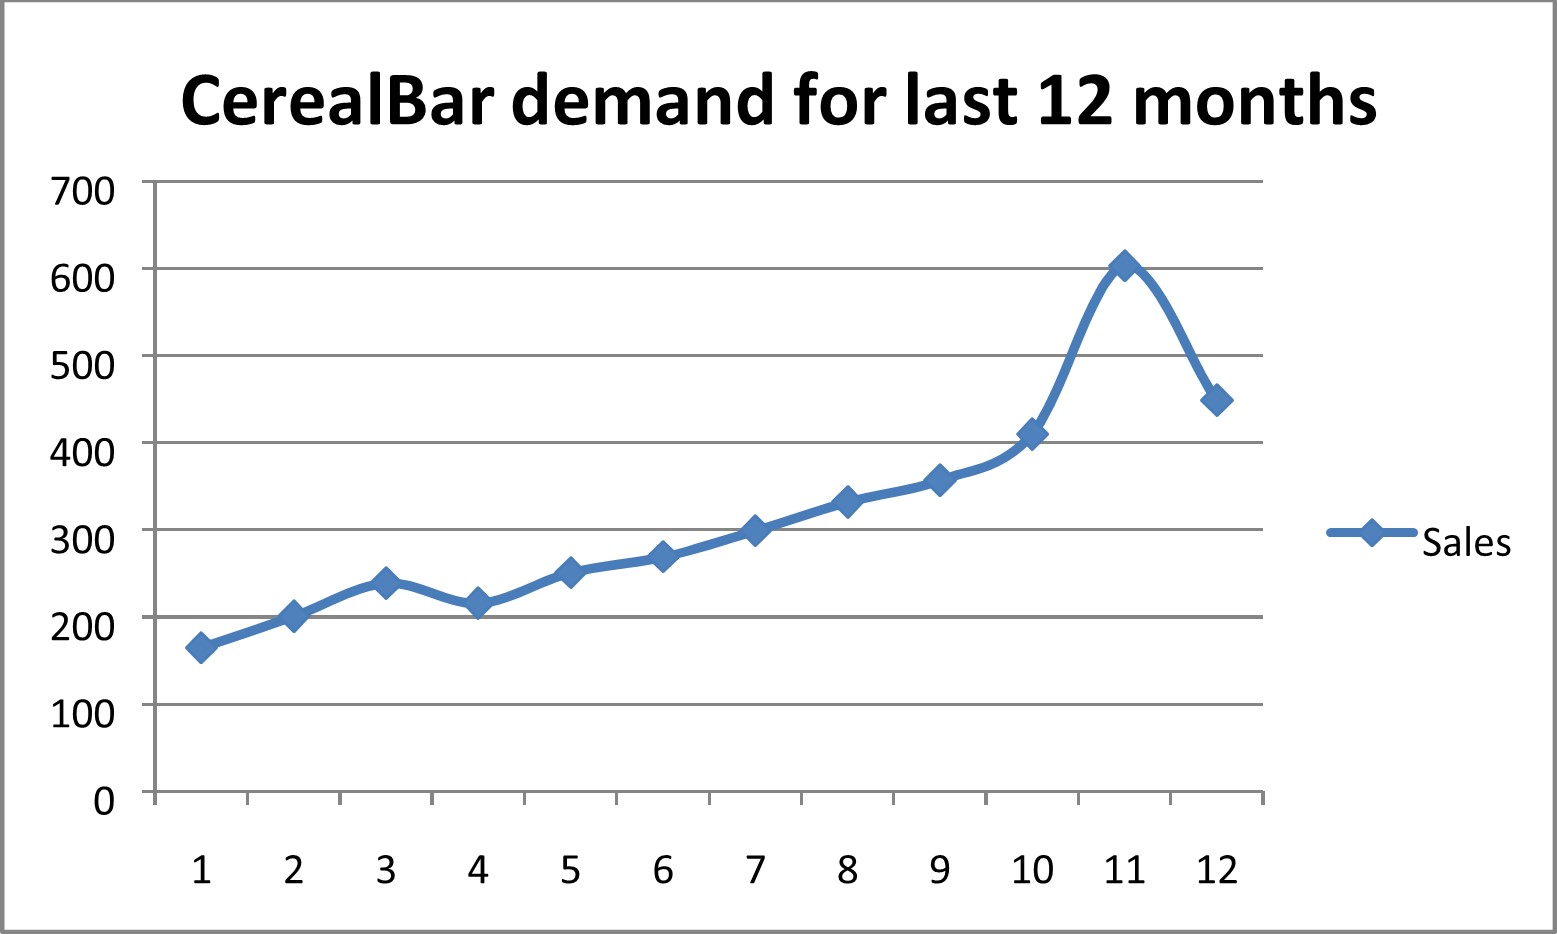
Your boss provides you with the sales for the last 12 months and the forecasts for the last 11 months. No data is available to forecast the first month as the product was totally new to the market at the time.
Visualization of the raw data
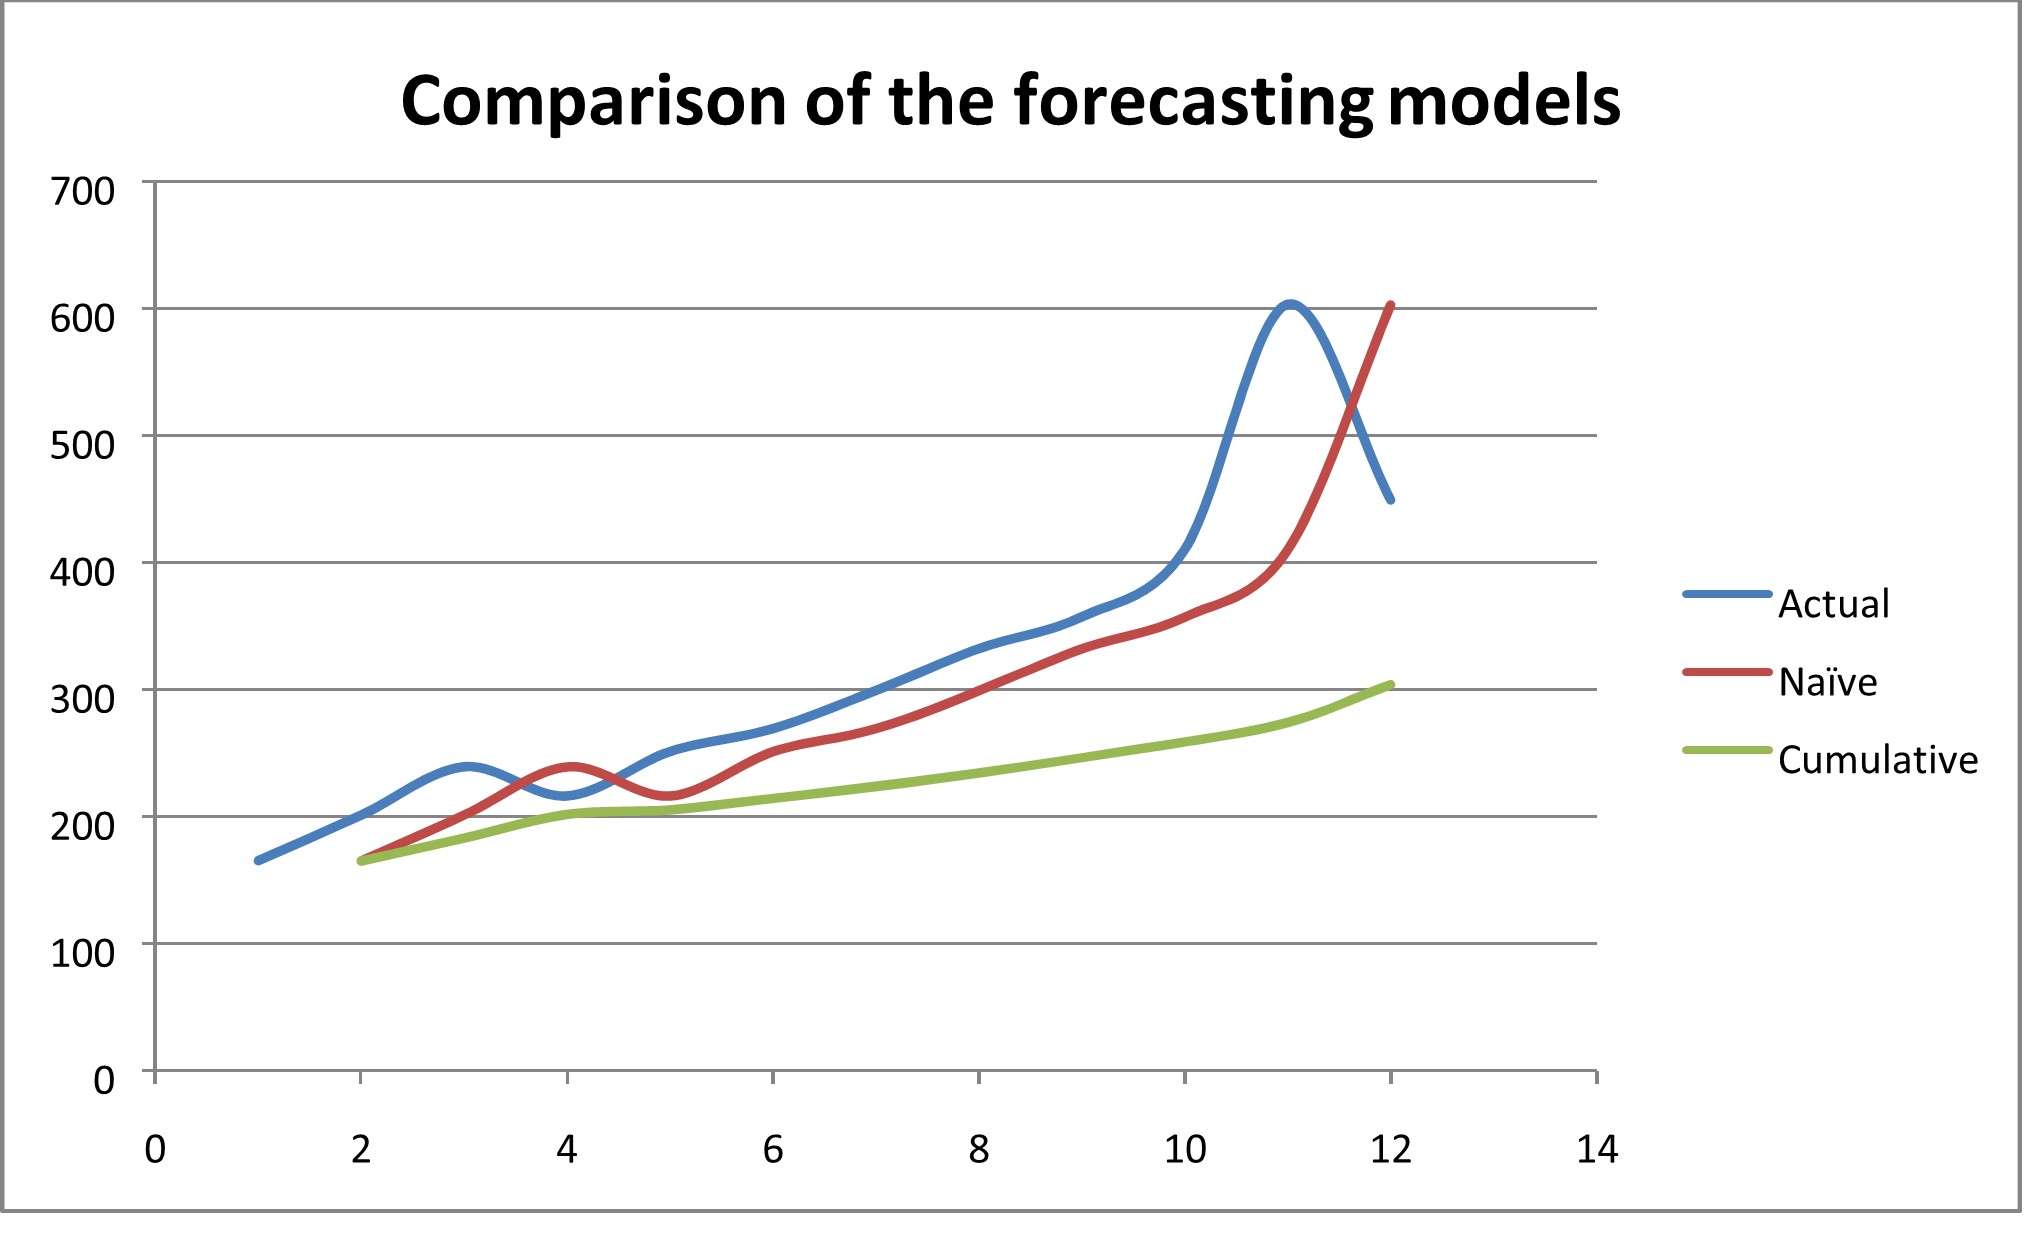
Comparison of the forecasting models
Comparison of Model Error Metrics
| Error Metric | RMSE | MAPE |
|---|---|---|
| Naïve Model | 80.45665 | 0.155729 |
| Cumulative Model | 131.226 | 0.269029 |
Conclusion:
The cumulative model in this case is worse than the Naïve model since the RMSE and the MAPE values are greater. It does not react quickly enough to adapt to the high variability in sales for this new gluten free cereal bar.