Performance characteristics of forecasting models
Objective
Investigate existing forecasting capabilities of Ordroid devices & provide suggestions.
Introduction
You have just been hired by a company that manufactures mid‐range communication devices that use the Ordroid open source operating system. The company is focused on innovating its products and has not put much thought on its inventory or forecasting capabilities. Your boss thinks there might be a problem in the forecasting of the Ordroid Devices and wants you to figure it out. The Ordroid, far from being new to the market, has been out for two years.
Knowing this, you have asked for data on both years of historical sales as well as any forecasts, promotions, pricing changes, or competitive analyses made during this time. Your boss laughs and provides you with all the data they have: the last six months of sales. You ask to meet with the current demand planner for the Ordroid Devices and she tells you that they use a forecasting algorithm of her own design and there is no documentation.
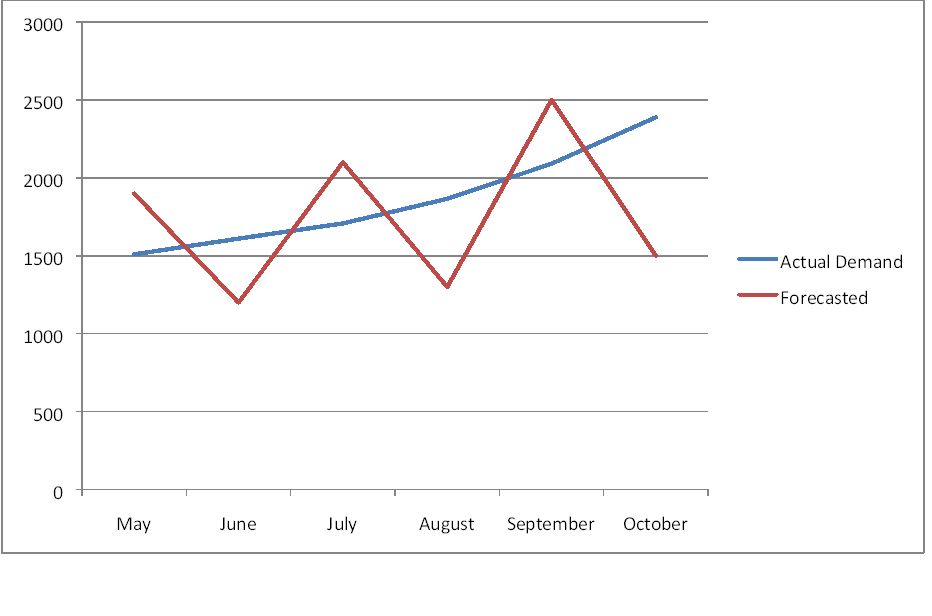
Visualization of the raw data
Raw data & forecasts supplied by the demand planner at Ordroid Devices
Calculate some different performance characteristics for the data sample given.
\[ MD=\frac{\sum_{i=1}^{n} (Actual_{i}-Forecast_{i})}{n} \] \[ MAD=\frac{\sum_{i=1}^{n} \lvert Actual_{i}-Forecast_{i}\rvert}{n} \] \[ RMSE=\sqrt{\frac{\sum_{i=1}^{n} (Actual_{i}-Forecast_{i})^2}{n}} \] \[ MPE=\frac{\sum_{i=1}^{n} \frac{ (Actual_{i}-Forecast_{i})}{Actual_{i}}}{n} \] \[ MAPE=\frac{\sum_{i=1}^{n} \lvert \frac{Actual_{i}-Forecast_{i}}{Actual_{i}}\rvert}{n} \]
| Number of devices | ||
|---|---|---|
| Mean Deviation | MD | 112.5 |
| Mean Absolute Deviation | MAD | 509.5 |
| Root Mean Square Error | RMSE | 540.6115 |
| Mean Percent Error | MPE | 0.04112 |
| Mean Absolute Percent Error | MAPE | 0.269002 |
Q1. What can you say about the presence seasonality of demand?
Seasonality requires a whole cycle. There is not even one full year of data. So as of now, it is too early to fully evaluate seasonality. You need at least two full cycles to determine seasonality.
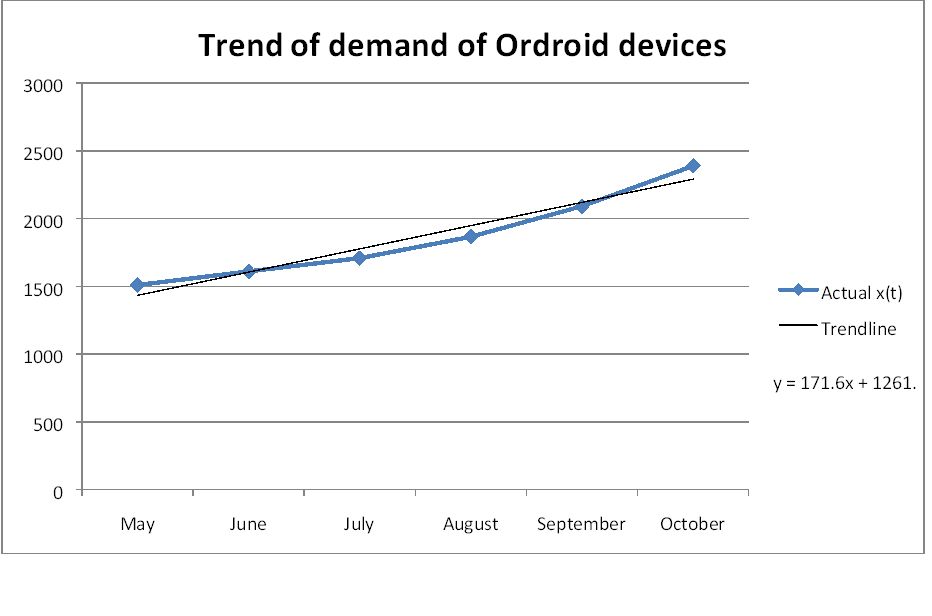
Q2. What can you say about the presence of a trend in the demand?
Although we don’t have a year’s worth of data, there seems to be a positive trend of about 10% increase in demand in the data or about 171 devices per month.
Q3. What can you say about the bias of the forecast?
A bias is a persistent tendency to over or under predict. These forecasts are not persistent in either. In fact, of the six periods, half are over forecast and half are under forecast. So, there does not appear to be any bias in the forecast.
Q4. What can you say about the accuracy of the forecast?
This is not a very good forecast because even though there is a strong positive trend, the forecasts ignores the trend & also the MAPE is almost 27% ‐ quite high.