Suitability of stationary demand models for forecasting
Objective
Study the suitability of stationary demand models for forecasting sales at the Shah Alam Palm Oil Company.
Introduction
Palm oil is harvested from the fruit of oil palm trees and is widely used as a cooking oil throughout Africa, Southeast Asia, and parts of Brazil. It is becoming widely used throughout the world as it is a lower cost alternative to other vegetable oils and has other attractive properties.
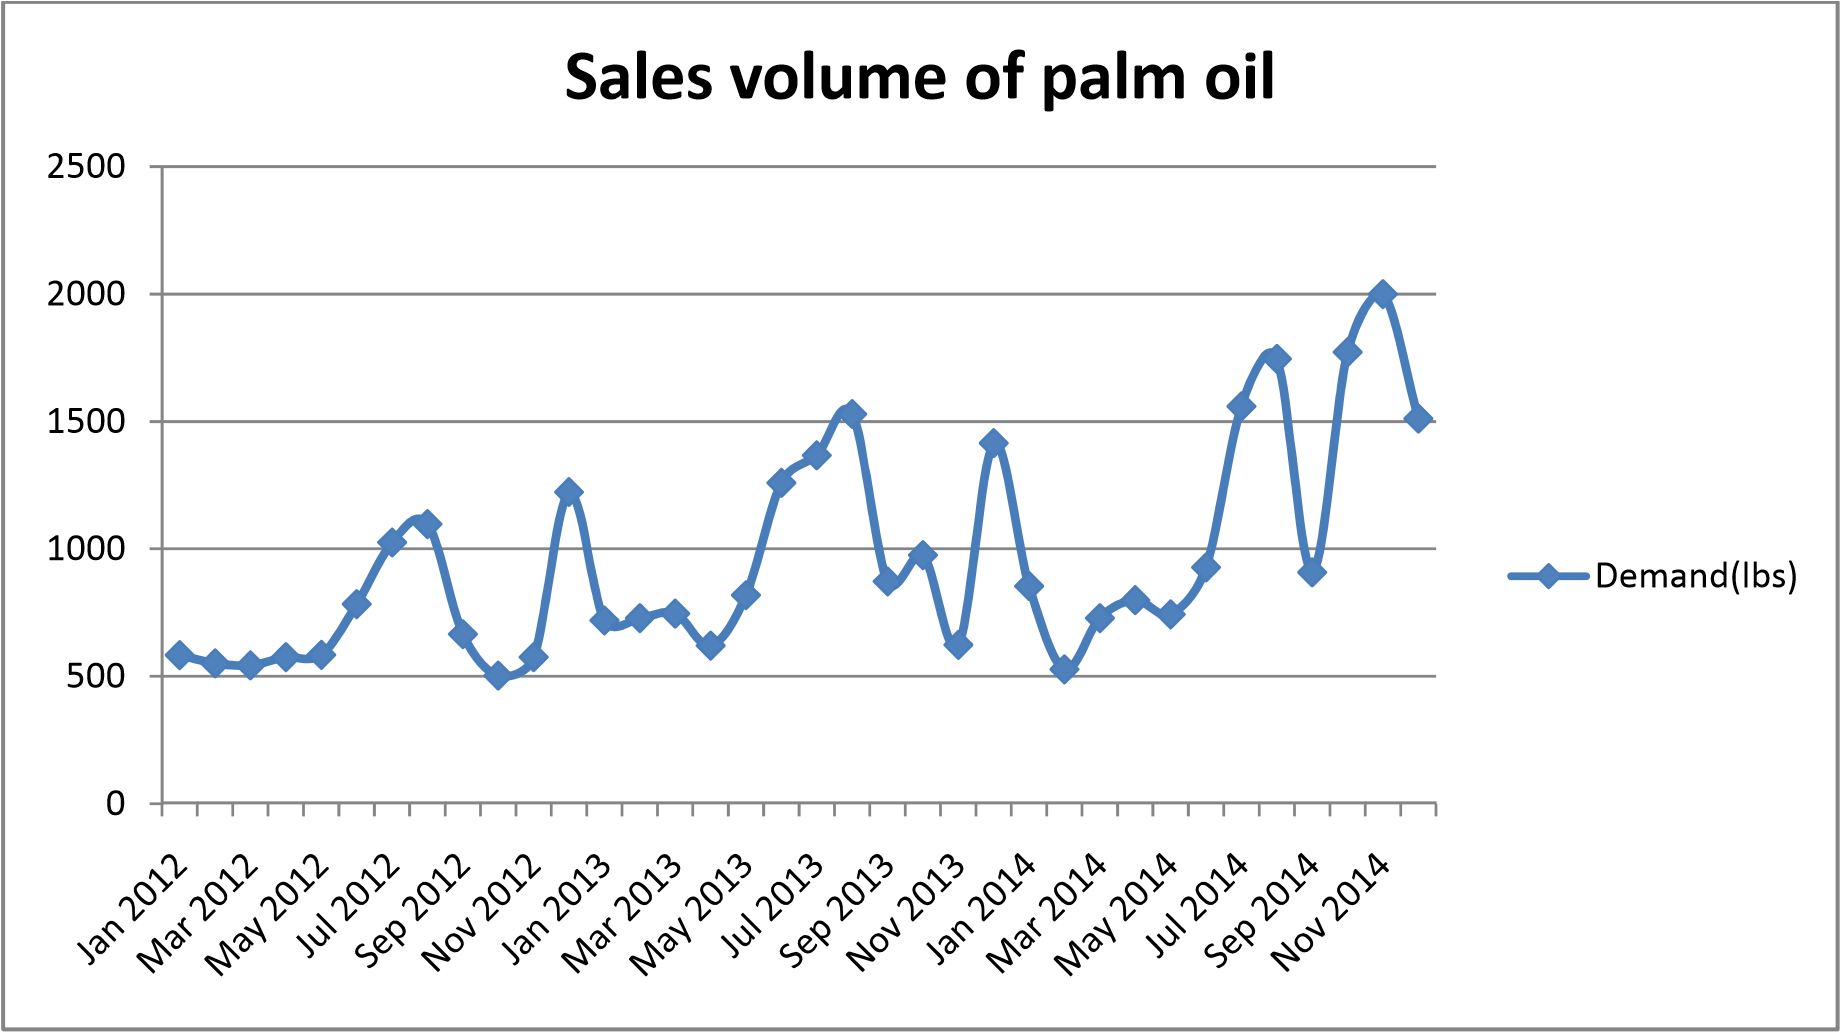
The Shah Alam Palm Oil Company (SAPOC) harvests, processes, and sells palm oil throughout the region. As a demand analyst, you are asked to review the sales volume (in pounds) of you premium palm oil by one of your customers, a local grocery store in the region.
Visualization of the raw data
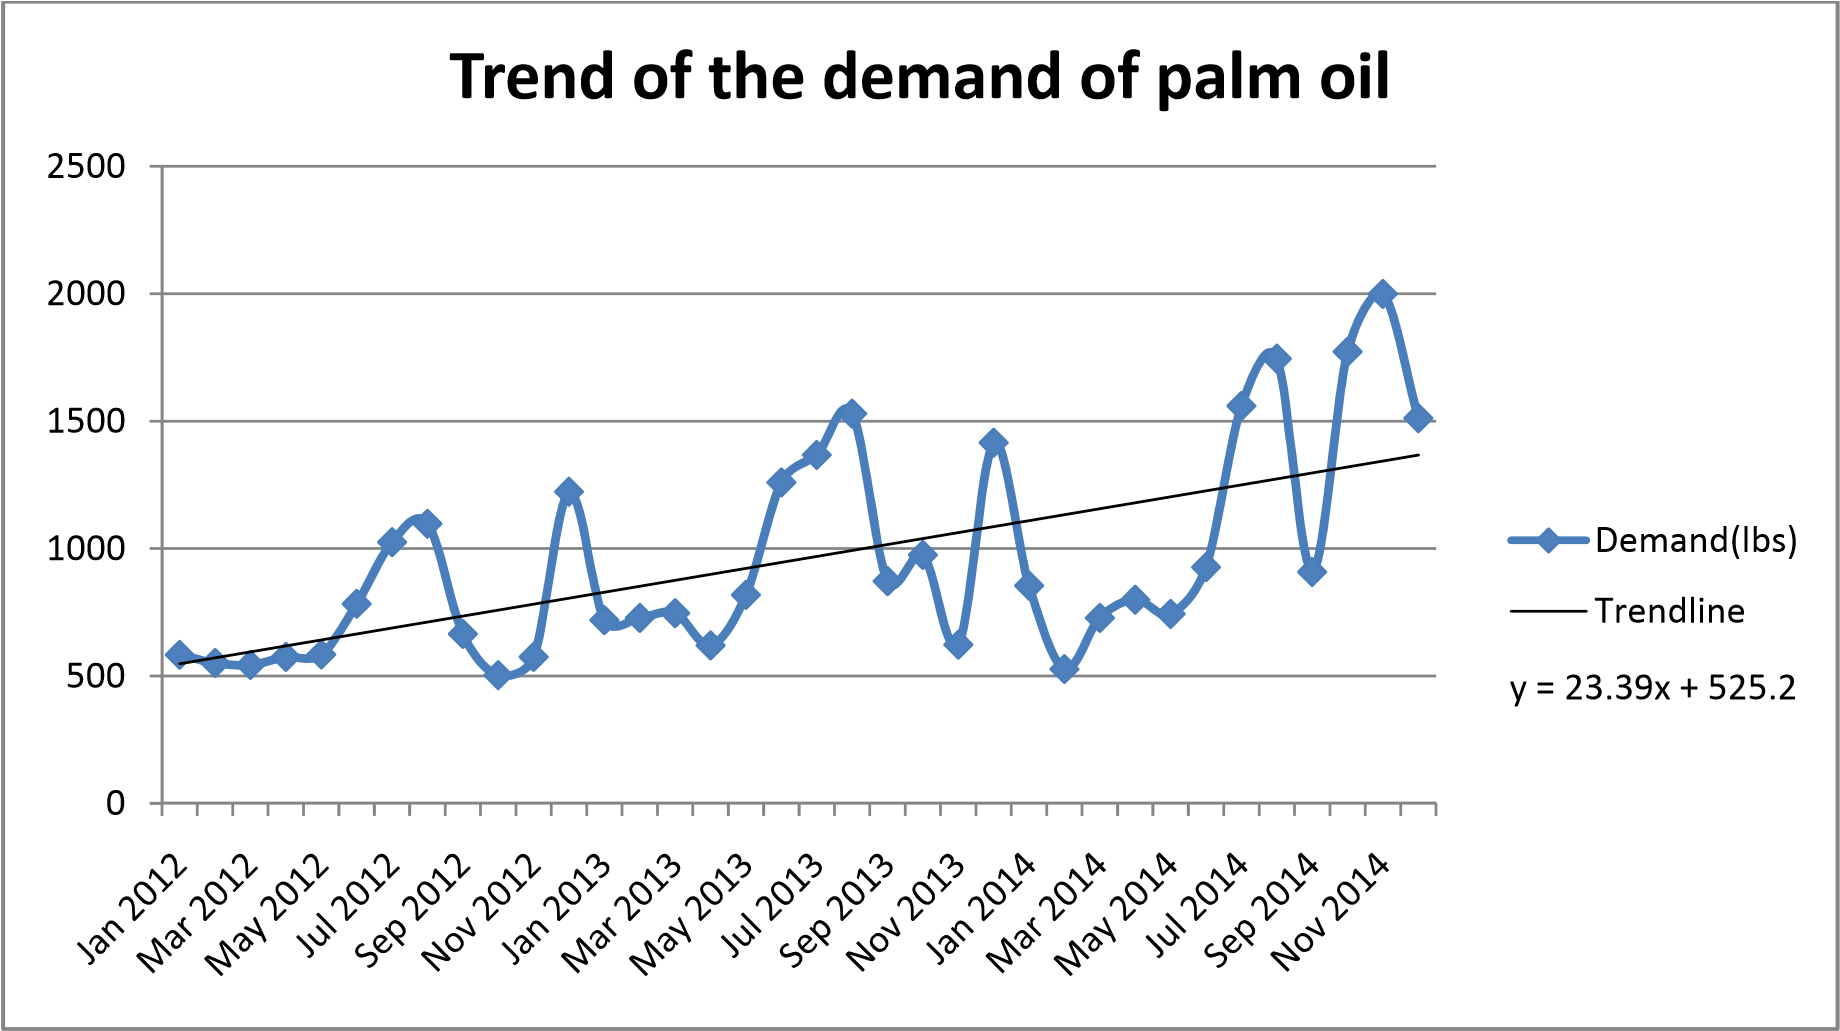
Q1. What is the trend over the last three years?
There appears to be a positive trend. From the graph there is an increase in the demand of palm oil by about 24 lbs per month for the last three years.
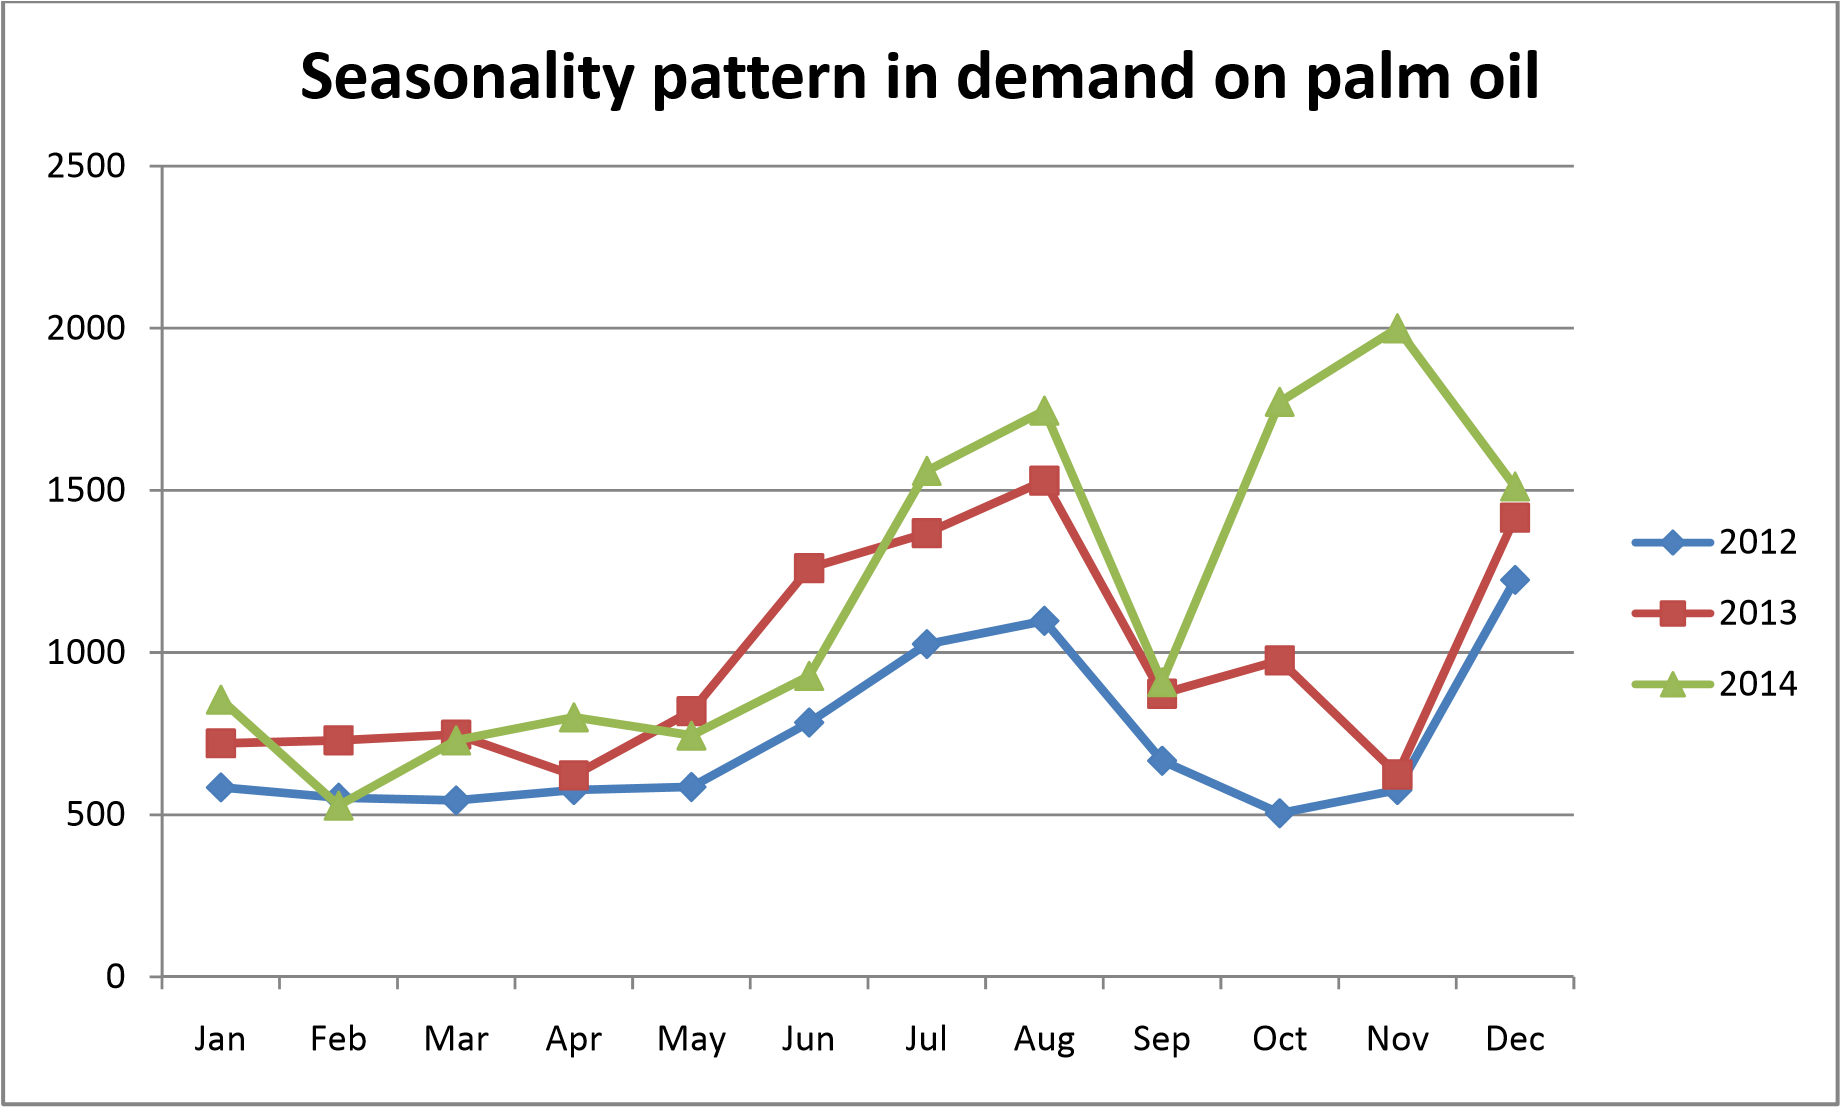
Q2. Does there appear to be any seasonality in the demand pattern?
Yes. If we plot the data by the months for each of the years, there seems to be seasonality to the demand. Demand is low from January to May. It picks up from June to August and then again from October to December.
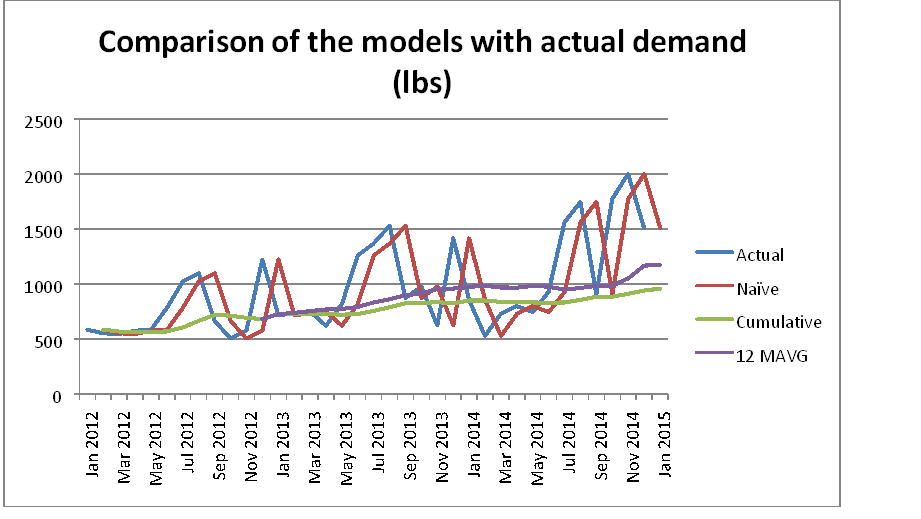
Q3. What is the forecast for demand in January 2015?
| Method | Forecast for Jan 2015 (lbs) | Actual value in Dec 2014 |
|---|---|---|
| Naïve Model | 1512 | 1512 |
| Cumulative Model | 957.9444 | 1512 |
| 12 Period Moving Average | 1173.667 | 1512 |
Q4. What is the root mean square error (RMSE) for a next period forecast for these three years of demand?
| Method | RMSE | |
|---|---|---|
| Naïve Model | 383.7282 | |
| Cumulative | 419.8851 | |
| 12 Period Moving Average | 423.33 |
Q5. Which of these three models is most appropriate for forecasting the January 2015 demand?
None. As shown above, the palm oil data shows a positive trend & seasonality during the years. The Naïve model forecast for Jan 2015 is clearly different from the previous trends. While the cumulative & naïve models are quite calm indicating they are forecasting demand closer to the average of the data. The main reason for this discrepancies is that the above three models assume a stationary demand that is very close to the level of the mean.